Volume: 14 Issue: 2
Peripheral Smear Morphology and Automated RBC Histogram Patterns in Patients with Anaemia: A Descriptive Study
Year: 2026, Page: 80-84, Doi: https://doi.org/10.47799/pimr.1402.26.76
Received: June 12, 2026 Accepted: Aug. 28, 2026 Published: Aug. 31, 2026
Abstract
Introduction: Automated haematology analysers provide red cell indices and graphical distributions that complement blood film examination, which remains essential for identifying morphological abnormalities and mixed cell populations.
Objective: To describe peripheral blood smear findings and automated RBC histogram patterns among anaemic patients and evaluate their distribution across different morphological patterns. Materials and Methods: This descriptive observational study was conducted at a tertiary care teaching hospital from February to April 2026. Anaemic patients fulfilling WHO 2024 criteria were included. Complete blood counts, RBC indices, and automated histograms were obtained using a Sysmex XN-1000 analyser, alongside peripheral blood smear evaluation. Results: Of 144 patients, 66.0% were female, and 47.9% were aged 31–40 years. Microcytic hypochromic anaemia was the most common morphological pattern (64.6%), followed by normocytic normochromic (20.1%), macrocytic (7.6%), and dimorphic anaemia (4.9%). Left-shifted histograms were seen in 38.2% of patients, broad-based curves in 30.6%, and normal curves in 18.1%. All 11 macrocytic anaemia patients (100%) showed right-shifted curves. Peripheral smears identified polychromatophils, red cell agglutination, and sickle cell morphology in four, two, and one patients, respectively. Four patients had pancytopenia. Conclusion: Microcytic hypochromic anaemia was the commonest morphological pattern. Histogram patterns varied with red cell morphology, while specific abnormalities such as agglutination, sickle cell morphology and polychromatophilia were identified on peripheral smear. RBC histograms provide useful information on red cell volume distribution but should be interpreted along with peripheral smear findings.
Keywords: Haemoglobin; Red cell indices; Microcytosis; Macrocytosis; Dimorphic anaemia; Peripheral blood film
INTRODUCTION
Anaemia is a common haematological condition and an important public health problem, particularly among children and women. Globally, anaemia affects an estimated 40% of children aged 6–59 months, 37% of pregnant women and 30% of women aged 15–49 years[1]. It is defined by a haemoglobin concentration below the age- and sex-specific cut-off[2]. Anaemia may result from nutritional deficiencies, blood loss, increased red cell destruction, chronic disease or impaired red cell production[2, 3].
Peripheral blood smear examination is an important part of the laboratory evaluation of anaemia. It provides direct assessment of red cell morphology and helps classify anaemia as microcytic hypochromic, normocytic normochromic, macrocytic or dimorphic. It also helps identify anisocytosis, poikilocytosis and abnormal red cell populations that may not be adequately reflected by automated parameters[4, 5].
Automated haematology analysers provide red cell indices such as mean corpuscular volume (MCV), mean corpuscular haemoglobin (MCH), mean corpuscular haemoglobin concentration (MCHC) and red cell distribution width (RDW). These parameters provide quantitative information on red cell size and its variation and are useful in the morphological assessment of anaemia[5, 6]. However, because these indices represent characteristics of the overall red cell population, mixed populations may not be adequately reflected by the mean values. In dimorphic populations, for example, the MCV may remain within the reference range despite the presence of two distinct red cell populations[7].
RBC histograms provide a graphical representation of the distribution of red cell volume and complement the numerical red cell indices. Changes in the position and shape of the histogram may be seen with microcytosis, macrocytosis and mixed red cell populations[7, 8]. Previous studies have described the relationship between peripheral smear findings, RBC indices and histogram patterns in anaemia[8-10]. Peripheral smear examination remains useful for assessing morphological abnormalities that may not be adequately identified by automated analysis[11].
The present study was undertaken to describe the peripheral blood smear findings and automated RBC histogram patterns among patients with anaemia and to assess their distribution across different morphological patterns.
MATERIALS AND METHODS
Study design and participants: This descriptive observational study was conducted in the haematology department of a tertiary care teaching hospital from February to April 2026. Patients referred for evaluation of anaemia during the study period and fulfilling the WHO 2024 age- and sex-specific criteria for anaemia were included[2]. A total of 144 patients met the eligibility criteria.
Ethical Approval:The study was approved by the Institutional Ethics Committee (Approval No. FAC/2026/174, dated 02 February 2026). Written informed consent was obtained from all participants before enrolment.
Exclusion criteria: Infants, individuals aged >60 years, pregnant women, and lactating women within one year of delivery were excluded. Patients with leukemoid reaction or leukaemia were also excluded.
Haematological evaluation: Complete blood counts, RBC indices and automated RBC histograms were obtained using the Sysmex XN-1000 five-part automated haematology analyser. Peripheral blood smears were examined for red cell morphology. Based on peripheral smear findings, anaemia was classified as microcytic hypochromic, normocytic normochromic, macrocytic or dimorphic. Pancytopenia was recorded separately and defined as a reduction in all three peripheral blood cell lines below their respective reference ranges[12, 13].
RBC histogram assessment: RBC histograms were interpreted according to the Sysmex XN-1000 operator manual. The patterns were classified as normal curve, left shift, right shift, broad base, bimodal and short peak. Curves beginning before 34 fL and reaching the baseline before 150 fL were classified as left-shifted, while those beginning after 34 fL and reaching the baseline after 150 fL were classified as right-shifted. Curves beginning at approximately 34 fL and extending to 225–250 fL were classified as broad-based. Curves showing two peaks were classified as bimodal. Short-peak patterns were recorded separately.
Statistical analysis: Data were analysed using IBM SPSS Statistics version 26. Categorical variables were expressed as frequencies and percentages.
RESULTS
| Age group (years) | Male, No. (%) | Female, No. (%) | Total, No. (%) |
|---|---|---|---|
| 1–10 | 3 (6.1) | 2 (2.1) | 5 (3.5) |
| 11–20 | 2 (4.1) | 1 (1.1) | 3 (2.1) |
| 21–30 | 10 (20.4) | 25 (26.3) | 35 (24.3) |
| 31–40 | 16 (32.7) | 53 (55.8) | 69 (47.9) |
| 41–50 | 12 (24.5) | 10 (10.5) | 22 (15.3) |
| 51–60 | 6 (12.2) | 4 (4.2) | 10 (6.9) |
| Total | 49 (100) | 95 (100) | 144 (100) |
Table 1: Age- and sex-wise distribution of study participants
| Morphological type | No. of patients | Percentage (%) |
|---|---|---|
| Microcytic hypochromic anaemia | 93 | 64.6 |
| Normocytic normochromic anaemia | 29 | 20.1 |
| Macrocytic anaemia | 11 | 7.6 |
| Dimorphic anaemia | 7 | 4.9 |
| Pancytopenia | 4 | 2.8 |
| Total | 144 | 100.0 |
Table 2: Distribution of patients according to peripheral smear findings
Out of the 144 enrolled patients, 95 (66.0%) were females and 49 (34.0%) were males. The highest number of patients was in the 31–40 years age group (69; 47.9%), followed by 21–30 years (35; 24.3%) and 41–50 years (22; 15.3%) [Table. 1].
Morphological pattern of anaemia: Microcytic hypochromic anaemia was the most common finding, seen in 93 (64.6%) patients, followed by normocytic normochromic anaemia in 29 (20.1%), macrocytic anaemia in 11 (7.6%) and dimorphic anaemia in 7 (4.9%). Pancytopenia was seen in 4 (2.8%) patients [Table. 2].
RBC histogram patterns: A left-shifted curve was the most common RBC histogram pattern, seen in 55 (38.2%) patients, followed by broad-based curves in 44 (30.6%) and normal curves in 26 (18.1%). Right-shifted, short-peak and bimodal patterns were observed in 12 (8.3%), 4 (2.8%) and 3 (2.1%) patients, respectively [Table. 3].
| RBC histogram pattern | No. of patients | Percentage (%) |
|---|---|---|
| Normal curve | 26 | 18.1 |
| Left shift | 55 | 38.2 |
| Right shift | 12 | 8.3 |
| Broad base | 44 | 30.6 |
| Bimodal | 3 | 2.1 |
| Short peak | 4 | 2.8 |
| Total | 144 | 100.0 |
Table 3: Distribution of patients according to RBC histogram pattern
| Smear morphology | Normal | Left shift | Right shift | Broad base | Bimodal | Short peak | Total |
|---|---|---|---|---|---|---|---|
| Normocytic normochromic | 20 | 0 | 0 | 9 | 0 | 0 | 29 |
| Microcytic hypochromic | 3 | 52 | 0 | 31 | 3 | 4 | 93 |
| Macrocytic | 0 | 0 | 11 | 0 | 0 | 0 | 11 |
| Dimorphic | 3 | 3 | 1 | 0 | 0 | 0 | 7 |
| Pancytopenia | 0 | 0 | 0 | 4 | 0 | 0 | 4 |
| Total | 26 | 55 | 12 | 44 | 3 | 4 | 144 |
Table 4: Distribution of RBC histogram patterns according to peripheral smear findings
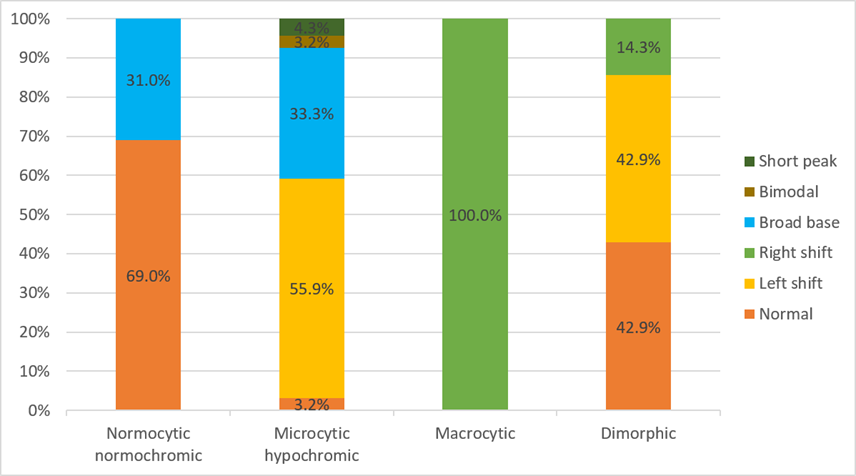
Fig. 1: Bar Chart showing distribution of RBC histogram patterns according to peripheral smear morphology
The distribution of RBC histogram patterns according to peripheral smear morphology is shown in [Table. 4] and [Fig. 1]. Left-shifted curves were observed in 52 of 93 microcytic hypochromic cases, while all 11 macrocytic cases showed right-shifted curves. Normal curves were seen in 20 of 29 normocytic normochromic cases, whereas all 4 cases of pancytopenia showed broad-based curves.
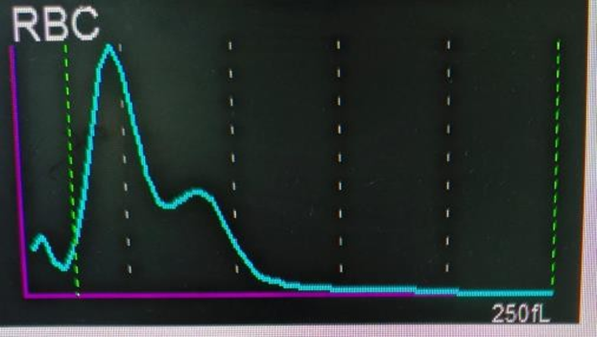
Fig. 2: Shows an automated red blood cell (RBC) histogram displaying a prominent bimodal distribution curve, which is typically indicative of a dimorphic red cell population
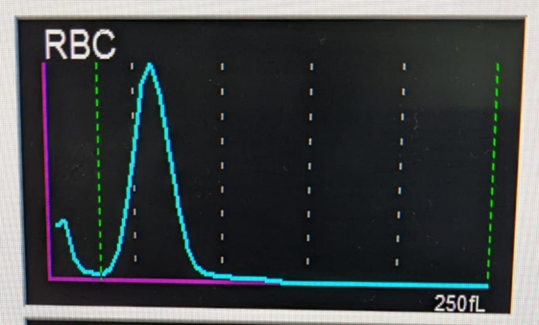
Fig. 3: An automated red blood cell (RBC) histogram displaying a narrow, left-shifted single peak that is suggestive of a microcytic red cell population
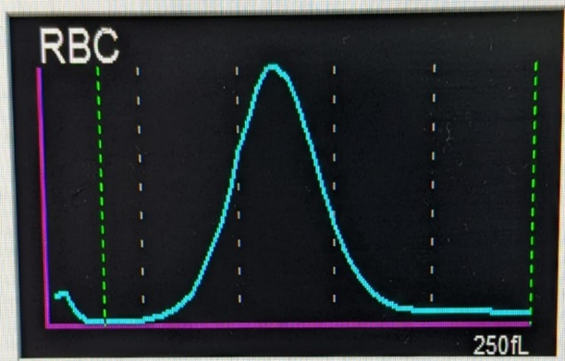
Fig. 4: An automated red blood cell (RBC) histogram displaying a right – shifted single peak that is suggestive of a macrocytic red cell population
Two patients with left-shifted histograms showed red cell agglutination on peripheral smear and subsequently tested positive on the Direct Antiglobulin Test. Sickle cell morphology was observed in one patient with a broad-based histogram. Polychromatophils were seen in four patients.
DISCUSSION
Although anaemia is defined by the haemoglobin concentration, its assessment involves the size, shape and haemoglobin content of red blood cells, together with the underlying process affecting red cell production and survival. These changes may occur with nutritional deficiencies, blood loss, haemolysis, marrow disorders or systemic diseases such as chronic liver disease. Thus, haemoglobin estimation identifies anaemia but does not indicate its morphological pattern or underlying cause[1].
In the present study, out of 144 anaemia patients, 95 (66.0%) were females and 49 (34.0%) were males. The 31–40 years age group had the highest number of patients in both females (53; 55.8%) and males (16; 32.7%), followed by the 21–30 years age group. Overall, these two age groups accounted for 104 (72.2%) patients. Microcytic hypochromic anaemia was the commonest morphological pattern (93; 64.6%), followed by normocytic normochromic anaemia (29; 20.1%), macrocytic anaemia (11; 7.6%) and dimorphic anaemia (7; 4.9%). Similar distribution, with microcytic hypochromic anaemia as the commonest pattern, has been reported by Kumar et al., Sandhya and Rashmi, and Swami et al.[8-10].
The RBC histogram provides information on the distribution of red cell volume in the analysed population. Constantino described its usefulness in recognising different red cell populations, particularly in dimorphic cases[7]. In the present study, the histogram patterns corresponded broadly with the morphological pattern on peripheral smear, with left-shifted curves associated with microcytic morphology and right-shifted curves with macrocytic morphology. Broad-based and variable patterns were observed in cases in which more than one red cell population may be present. Kumar et al. also reported a relationship between peripheral smear findings and automated red cell parameters in anaemia[8].
Swami et al., in 176 anaemia patients, reported left-shifted curves in microcytic hypochromic anaemia, right-shifted curves in macrocytic anaemia and variable patterns in dimorphic anaemia[10]. Sandhya and Rashmi, in 500 anaemia patients, reported an association between peripheral smear findings and RBC indices/histogram patterns, with a Cramer's V of 0.523[9]. These studies support the observation that histogram patterns provide information on the distribution of red cell size and can be interpreted along with peripheral smear morphology rather than as an isolated finding.
Four patients had pancytopenia, and all four showed broad-based RBC histograms. A broad-based histogram in these cases may reflect variation in red cell size, but the small number of cases does not allow any specific interpretation of this finding. Pancytopenia requires evaluation of all three cell lines and its underlying cause cannot be determined from the RBC histogram alone[12, 13].
The peripheral smear also provided findings that could not be characterised from the histogram pattern alone. Red cell agglutination was seen in two patients with left-shifted histograms and both subsequently tested positive on the Direct Antiglobulin Test. Sickle cell morphology was observed in one patient with a broad-based histogram, while polychromatophils were seen in four patients. These observations support the role of peripheral smear examination in recognising morphological abnormalities that may not be adequately identified by automated analyser data[14, 15].
The study also has certain limitations. It was conducted at a single tertiary care centre and included 144 patients over a three-month period. The number of patients in some categories, particularly macrocytic and dimorphic anaemia, was small. The study also did not evaluate the underlying causes of anaemia or clinical outcomes. These factors limit the extent to which the findings can be applied to other patient populations.
CONCLUSION
Microcytic hypochromic anaemia was the commonest peripheral smear finding (64.6%) in this study. The RBC histogram pattern showed variation according to the peripheral smear morphology, with left-shifted curves observed with microcytic morphology and right-shifted curves in all macrocytic cases. Broad-based curves were seen in normocytic, microcytic and pancytopenic cases, while variable patterns were observed in dimorphic anaemia. Red cell agglutination, sickle cell morphology and polychromatophilia were identified on peripheral smear in a few cases despite the corresponding histogram patterns. Therefore, RBC histograms can provide useful information on red cell volume distribution but should not be interpreted in isolation. Interpretation alongside peripheral blood smear findings, particularly in cases with mixed or abnormal red cell populations, remains important for morphological assessment of anaemia.
References
1. World Health Organization. Anaemia. Geneva: World Health Organization. 2025 Feb 10; Available from: https://www.who.int/news-room/fact-sheets/detail/anaemia
2. World Health Organization. Guideline on haemoglobin cutoffs to define anaemia in individuals and populations. Geneva: World Health Organization. 2024; Available from: https://iris.who.int/server/api/core/bitstreams/f9f74397-1440-478d-a63c-26f29a01552f/content
3. Kaushansky K, Lichtman MA, Prchal JT, Levi M, Burns LJ, Linch DC, editors. Williams Hematology. 10th ed. New York: McGraw Hill; 2021.
4. Greer JP, Arber DA, Glader B, List AF, Means RT, Rodgers GM, et al., editors. Wintrobe's Clinical Hematology. 14th ed. Philadelphia: Wolters Kluwer; 2018.
5. Bain BJ. Blood Cells: A Practical Guide. 5th ed. Chichester: Wiley-Blackwell; 2015. Available from: https://doi.org/10.1002/9781118817322
6. Hoffbrand AV, Steensma DP. Hoffbrand's Essential Haematology. 8th ed. Chichester: Wiley-Blackwell; 2019.
7. Constantino BT. The red cell histogram and the dimorphic red cell population. Laboratory Medicine. 2011; 42 (5). Available from: https://doi.org/10.1309/lmf1uy85hekbmiwo
8. Kumar A, Kushwaha R, Gupta C, Singh US. An analytical study on peripheral blood smears in anemia and correlation with cell counter generated red cell parameters. Journal of Applied Hematology. 2013; 4 (4). Available from: https://doi.org/10.4103/1658-5127.127896
9. Sandhya V, Rashmi GSB. Correlation of peripheral smear with RBC indices and RBC histograms in the diagnosis of anemia. Indian Journal of Pathology and Oncology. 2017; 4 (2). Available from: https://ijpo.co.in/archive/volume/4/issue/2/article/17545
10. Swami L, Bhatt N, Khumanthem G, Bansal I, Sale S, Mane V. Correlation of peripheral smear with RBC indices and RBC histogram in the diagnosis of anemia. Indian Journal of Pathology and Oncology. 2020; 7 (4). Available from: https://doi.org/10.18231/j.ijpo.2020.109
11. Basu D. In the Era of Automation and Molecular Techniques, is Peripheral Blood Smear Examination Getting Redundant?. International Journal of Advanced Medical and Health Research. 2022; 9 (1). Available from: https://doi.org/10.4103/ijamr.ijamr_104_22
12. Gnanaraj J, Parnes A, Francis CW, Go RS, Takemoto CM, Hashmi SK. Approach to pancytopenia: Diagnostic algorithm for clinical hematologists. Blood Reviews. 2018; 32 (5). Available from: https://doi.org/10.1016/j.blre.2018.03.001
13. Chiravuri S, De Jesus O. Pancytopenia. StatPearls [Internet]. Treasure Island (FL): StatPearls Publishing. 2026; Available from: https://www.ncbi.nlm.nih.gov/books/NBK563146/
14. Winther-Larsen A, Vestergaard EM, Abildgaard A. Clinical value of smear review of flagged samples analyzed with the Sysmex XN hematology analyzer. Clinical Chemistry and Laboratory Medicine (CCLM). 2025; 63 (3). Available from: https://doi.org/10.1515/cclm-2024-0973
15. Courville EL, Grant M, Mason E, Chen X, d'Onofrio G, Hedley B, et al. Performance of Automated Hematology Analyzer Criteria in Detecting Peripheral Blood Smear Abnormalities: A Systematic Literature Review. International Journal of Laboratory Hematology. 2026; Available from: https://doi.org/10.1111/ijlh.70139
Copyright
©2026 Chennupati et al. This is an open-access journal, and articles are distributed under the terms of the Creative Commons Attribution License CC-BY 4.0. (https://creativecommons.org/licenses/by/4.0/) which permits unrestricted use, distribution, and reproduction in any medium, provided the original authors and source are credited.
Cite this article
Chennupati VSL, Pathange D, Balina LN, Kasturi S, Shastry S. Peripheral Smear Morphology and Automated RBC Histogram Patterns in Patients with Anaemia: A Descriptive Study. Perspectives in Medical Research. 2026; 14(2):80-84. DOI: 10.47799/pimr.1402.26.76